Display the distribution of the variables
Source:R/exploratory_data_analysis.R
eda_variable_distribution.Rd![[Experimental]](figures/lifecycle-experimental.svg)
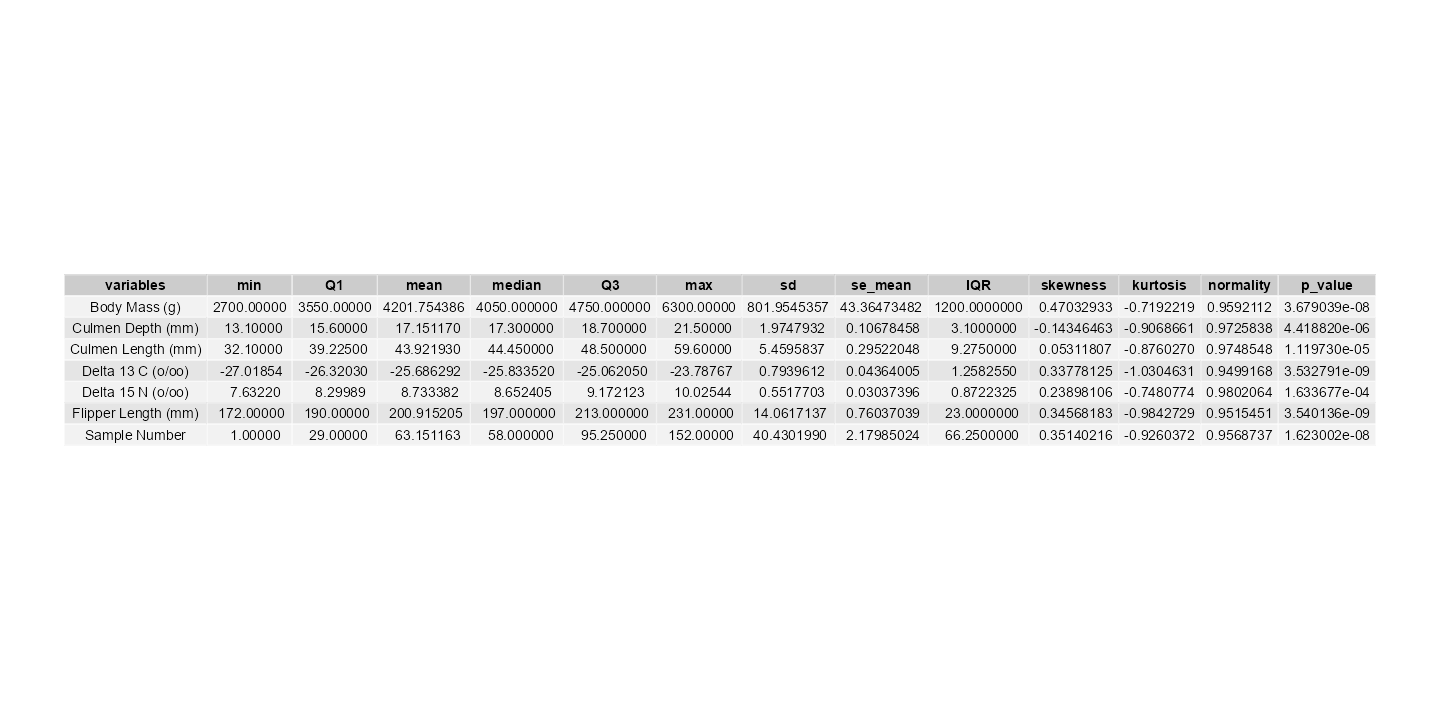
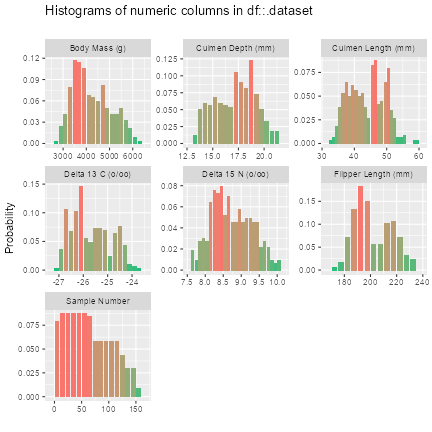
Exports the distribution of the numeric variables within a data frame into a temporary directory. This includes a histogram for each variable and table of summary statistics, including the range, quartiles, mean, medium, standard deviation, standard error of the mean, level of skewness, kurtosis and normality.
eda_variable_distribution(.dataset)
Arguments
| .dataset | A data frame requiring exploratory data analysis. |
|---|
Value
The data frame is returned invisibly so that the function can be used in a piped workflow.
Figures
See also
Other exploratory data analysis:
eda_variable_collection(),
eda_variable_correlation(),
eda_variable_outliers(),
eda_variable_summary()
Examples
# example from palmerpenguins
# https://allisonhorst.github.io/palmerpenguins/reference/penguins_raw.html
suppressPackageStartupMessages({
  library(store)
  suppressWarnings({
    library(palmerpenguins)
  })
})

suppressMessages({eda_variable_distribution(penguins_raw)})

# move figures from temporary directory
suppressPackageStartupMessages({
  suppressWarnings({
    library(fs)
    library(here)
  })
})
if(dir_exists(here("man", "figures"))) {
  file_move(path(tempdir(), "figures", "06-distribution_table.png"),
            here("man", "figures", "06-distribution_table.png"))

  file_move(path(tempdir(), "figures", "07-distribution_plot.png"),
            here("man", "figures", "07-distribution_plot.png"))
}